









Cảm ơn bạn đã xếp hạng và phản hồi của bạn!
Bạn đã đánh giá.

Descartes, cực, tham số và dữ liệu lô. Gaussian và đa thức phù hợp.
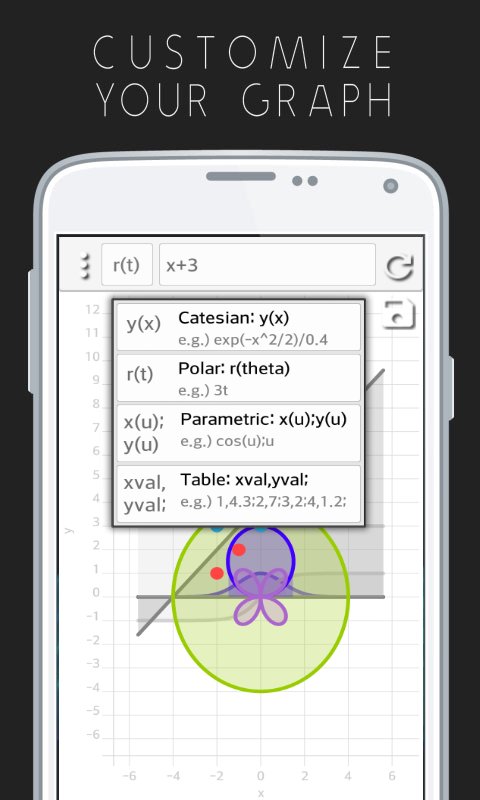
-Write y(x), r(theta), or x(u);y(u) function to plot, and type your data to display it in the graph.
-curve (Gauss, polynomial) fitting.
-It's simple and easy.
-User can change the color, resolution, and x-limit.
-User can save the graph as a screenshot file.





Một cú nhấp chuột để cài đặt các tệp XAPK/APK trên Android!
Cảm ơn bạn đã xếp hạng và phản hồi của bạn!
Bạn đã đánh giá.