









شكرًا لتقييمك وتعليقاتك!
لقد أكملت التقييم سابقًا

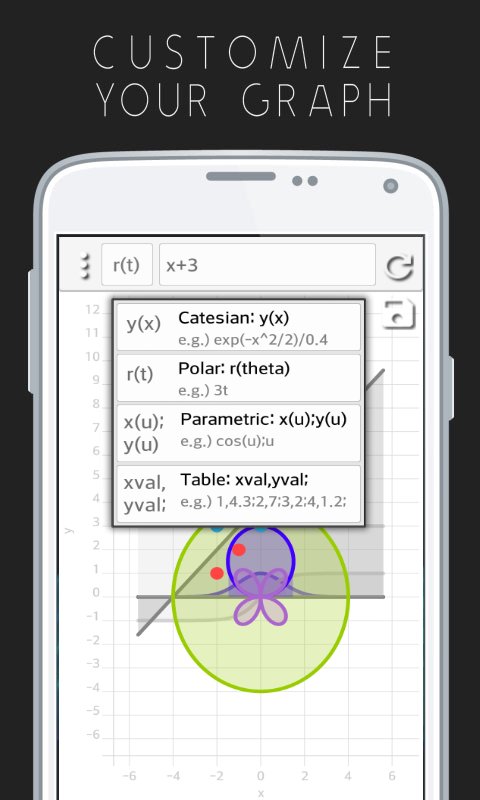
الديكارتية، القطبية، حدودي والبيانات المؤامرات. جاوس ومتعدد الحدود المناسب.
-Write y(x), r(theta), or x(u);y(u) function to plot, and type your data to display it in the graph.
-curve (Gauss, polynomial) fitting.
-It's simple and easy.
-User can change the color, resolution, and x-limit.
-User can save the graph as a screenshot file.





قم بتثبيت ملفات XAPK/APK بنقرة واحدة على أندرويد!
شكرًا لتقييمك وتعليقاتك!
لقد أكملت التقييم سابقًا